
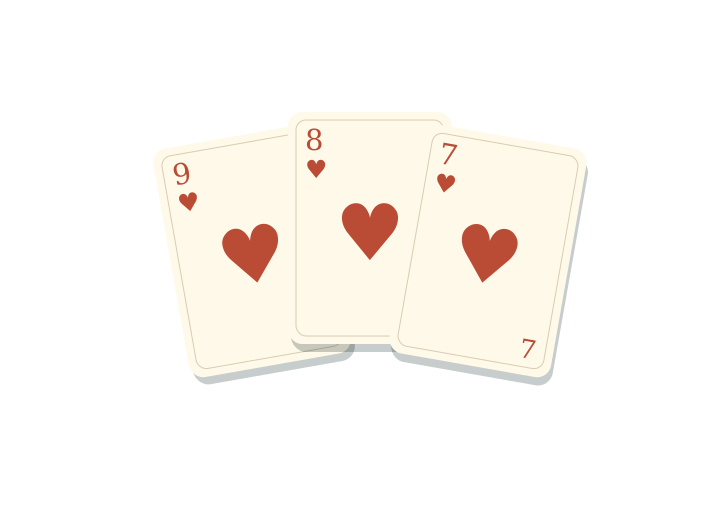
Category frequencies
| Category | Distinct hands | Probability |
|---|---|---|
| Trail | 52 | 0.2353% |
| Pure sequence | 48 | 0.2172% |
| Sequence (not pure) | 720 | 3.2579% |
| Colour (not pure sequence) | 1,096 | 4.9593% |
| Pair | 3,744 | 16.9412% |
| High card | 16,440 | 74.3891% |
Percentages are rounded. Categories are mutually exclusive: pure sequences are removed from the ordinary sequence and colour counts.
How the counts are derived
- All hands: choose 3 from 52, or 52 × 51 × 50 ÷ 6 = 22,100.
- Trail: 13 ranks × 4 ways to choose 3 of the 4 suits = 52.
- Pure sequence: 12 valid rank runs × 4 suits = 48.
- Sequence excluding pure: 12 × (4³ − 4) = 720.
- Colour excluding pure: 4 × choose(13, 3) − 48 = 1,096.
- Pair: 13 pair ranks × choose(4, 2) × 12 other ranks × 4 suits = 3,744.
- High card: the remaining 16,440 hands after subtracting the other categories.
Assumptions that matter
This calculation treats A-2-3 and A-K-Q as runs and excludes K-A-2. It assumes no jokers, no wild cards and no lowest-hand variant. The relative order of the two Ace runs does not change how many runs exist.
The totals are mathematical enumeration, not observed app results. They do not establish that any online service deals fairly or uses these exact rules.
Frequency is not win probability
A pair appears in roughly 16.94% of all possible three-card hands. That does not mean a pair has a 16.94% chance of beating another hand. Opponent count, known cards and the comparison rules change the question. Previous deals do not create a debt that a future shuffle must repay.
Use the hand checker to learn recognition, not to forecast the next deal. No sequence of results guarantees a future category or a monetary return.